No matter how boring and dry the word metrics may sound, all self-respecting game developers need to reckon with them to understand what latent seething processes occur with the game after it has successfully hit the market and how to act so that it starts to make a profit.
And here the question arises.
What do you think is the most important gaming metric? Probably the number of downloads? Or the number of hours spent in the game? Or the number of concurrent users? Or …
Stop guessing! The truth is that all metrics are important. Each of them provides valuable information that, like a piece of the puzzle, adds up to a whole picture of understanding the interaction of players with the game.
Working with metrics distinguishes successful game companies from incompetent newbies who work at random. Game metrics help you immediately know what the problem is and what needs to be done to improve performance, retention, and so on.
And today we are here to discuss the types of game metrics and how to measure them. Not without interesting additional sidenotes associated with each of them, which will allow you to better understand the essence of all these figures. Let’s go.
What Are Game Metrics?
Game metrics are numerical measures used to evaluate the performance of a game.
There are many different game metrics, each of which is responsible for different aspects of the player’s interaction with the game. They can be roughly divided into 3 categories:
Financial metrics:
- Average revenue per user (ARPU).
- User acquisition cost.
- Average transaction value (ATV).
Quantitative metrics:
- Daily active users (DAU).
- Monthly active users (MAU).
- Stickiness rate.
Behavioral metrics:
- Session length.
- Retention rate.
- Churn rate.
By analyzing game metrics, developers can find out what players like and dislike about the game and adjust the game content and monetization strategies in time.
Why Are Game Metrics So Important?
As we’ve said before, game analytics metrics are the best way for developers to get feedback from players.
Gaming metrics data provides important information about:
- where users experience difficulties;
- what content they like and dislike;
- what brings in the most profit;
- why players leave the game;
- what needs to be done to improve retention, and so on.
Without video game metrics, developers would have to work blindly. They would not be able to evaluate the effectiveness of the game, nor to adapt it to the needs of the user. As a result, they would lose money.
If you don’t want to lose money, learn what game metrics matter.
10 Key Game Metrics Developers Should Track
Financial Metrics
Average Revenue per User (ARPU)
The average revenue per user is a metric that tracks the revenue generated by the average user over a specific period.
This metric includes tracking both the money players have spent in-game and how many ads the average user clicks on. It is tracked in so-called free-to-play games, which are actually free to play, but contain paid content and ads.
The average revenue per user can be calculated by dividing revenue for a certain period by the number of users for this period.
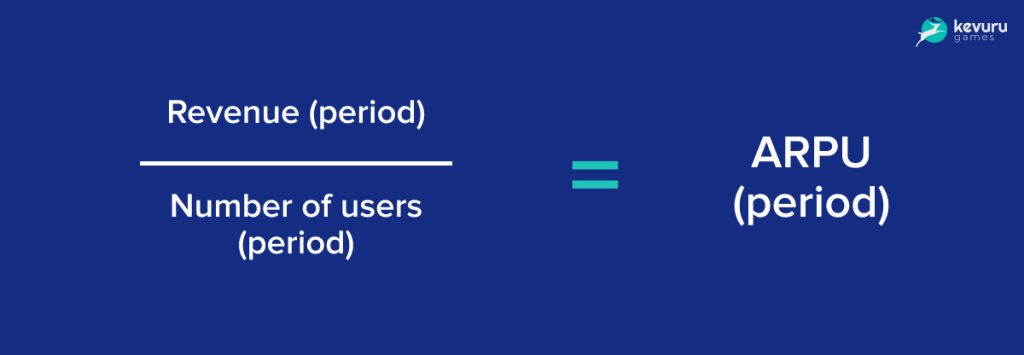
A similar principle is used to calculate the average revenue per daily active user (ARPDAU), the average revenue per weekly active user (ARPWAU), and the average revenue per monthly active user (ARPMAU).
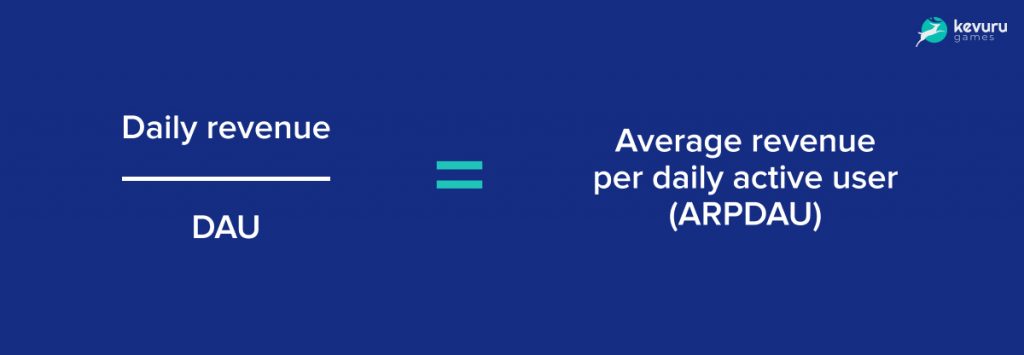
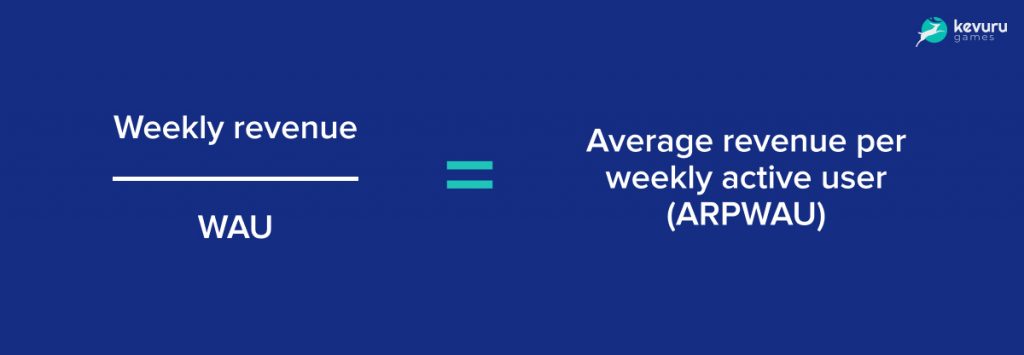
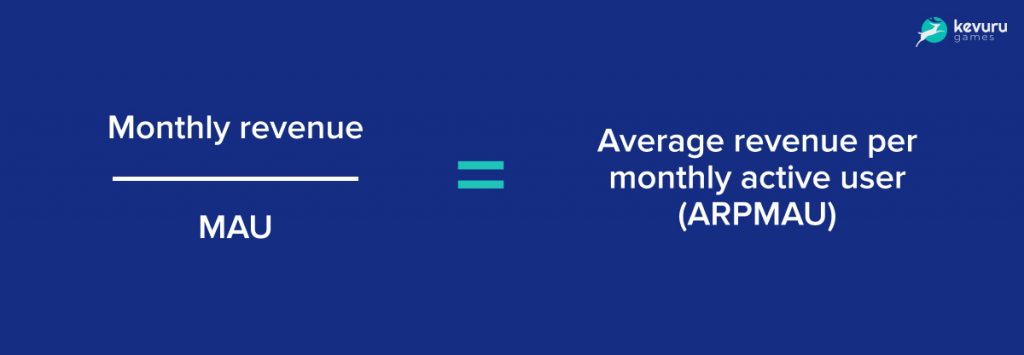
This metric won’t tell you how to improve your game design either, but it is a good measure of the success of your monetization strategy.
User Acquisition Cost
User acquisition cost is a metric that shows how much a company spends to acquire each player.
Also known as Cost Per Install, it allows you to measure the effectiveness of advertising efforts and marketing strategies such as ads in other games.
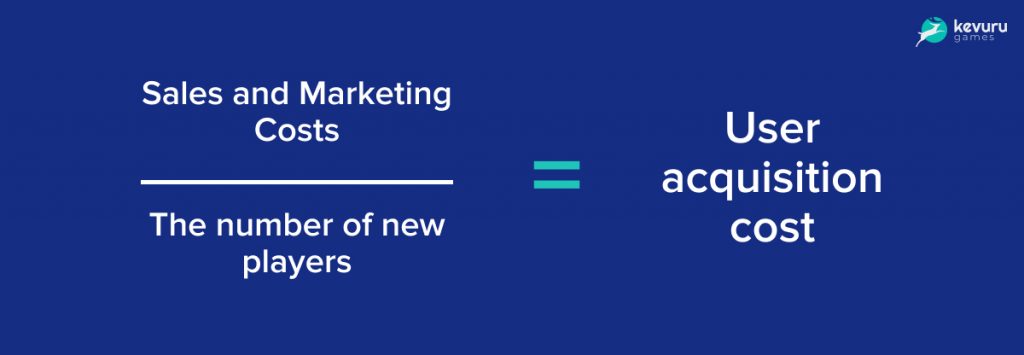
The user acquisition cost can be calculated by dividing sales and marketing costs by the number of new players.
According to Liftoff’s Mobile Gaming Apps Report, the average user acquisition cost is $1.47.
Average Transaction Value (ATV)
Average transaction value is a metric that shows the average amount of money spent by a consumer on a single transaction.
This metric is for games that offer in-game purchases. It tracks how much players spend on average per transaction. Even if players can only transact with your in-game currency without using real money, it’s important to keep track of ATV so you can check if your in-game economy is okay.
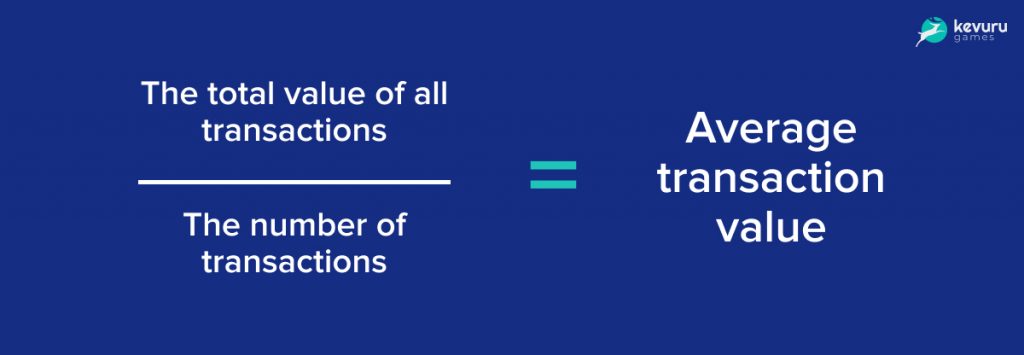
The average transaction value can be calculated by dividing the total value of all transactions by the number of transactions.
Quantitative Metrics
Daily Active Users (DAU)
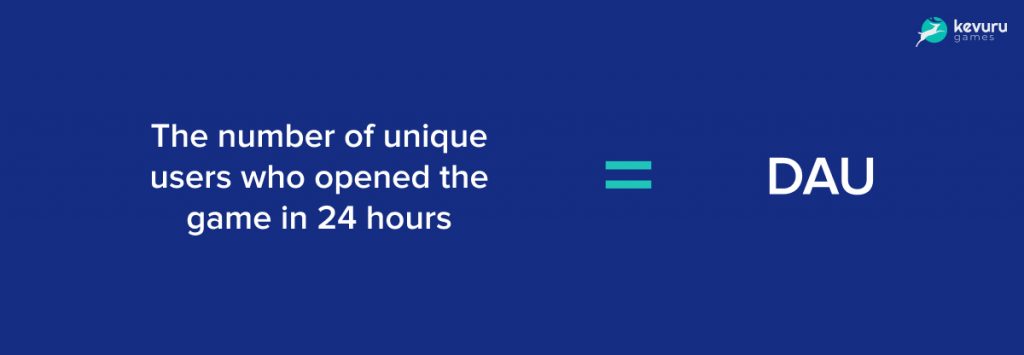
Daily active users is a metric that shows the number of unique users who have launched the game in the last 24 hours.
This is one of the most revealing metrics for game development, showing how interesting your game is to users. A sudden drop or increase in the number of daily users after the next update or fix makes it possible to quickly conclude how successful the work on the game was.
To find out DAU, just look at the number of unique users in 24 hours. The uniqueness of users is determined by ID or login.
Monthly Active Users (MAU)
Monthly active users is a metric that shows the number of unique users who have launched the game in the last 30 days.
As with DAU, MAU shows how many players log into the game at least once during the month. Together with the daily active users metric, it can help calculate the retention rate. For example, if a player logged into the game for many days and then stopped, this may indicate technical or content problems.
MAU is calculated in the same way as DAU, taking into account only unique users.

It is important to understand that the MAU for a given month is not the sum of the DAU for 30 days, as we are talking about unique users. For example, a player can log into the app on Monday and Wednesday, so they will get into the DAU for these days. But within the framework of the monthly metric, they will be taken into account only once.
Stickiness Rate
The stickiness rate is a metric that shows how often users return to the game.
Also known as loyalty rate, stickiness rate can be calculated by dividing DAU by MAU. If you want to know the weekly stickiness, DAU is divided by WAU ‒ weekly active users.

If the stickiness rate is:
- high ‒ users often visit the game and recommend it to their friends;
- low ‒ user interest has faded, and the game has ceased to be in demand.
At high DAUs, engagement can be low. And then there comes a point when the further growth of the game depends on its actual use. When a lot of people download but don’t log in or abandon because they’re not interested, ads and rave reviews from bloggers can’t save the day.
Marketer Andrew Chen believes that a very good stickiness rate is above 20%. The Facebook DAU/MAU indicator is 50%, which is already the world level.
Behavioral Metrics
Session Length
Session length is a metric that measures the amount of time a user spends playing a game.
The session starts when the game is opened and lasts until the game is closed or the user becomes inactive.
To calculate the session length, it is necessary to fix the time interval between when users opened the game and when they became inactive.

This is one of the metrics for game development that allows you to understand how users interact with different areas of content. For example, if the player interacts with a difficult level for a short time, it can be concluded that the content is too complex and frustrating. Conversely, if the user stays in the game for a long time on a difficult level, this may mean that the content is difficult, but not frustrating.
The longer the session, the more satisfied the player is with the gameplay. However, specific session lengths vary greatly by game genre and should only be compared within their own category.
Interesting facts about session length
- According to Soomla, the average length of a gaming session is 4-5 minutes. However, for card and casino games, the average duration of a session can even reach 30 minutes.
- In multiplayer and strategy games, the average session length is often more than 50 minutes, and the puzzle genre is of interest to players for an average of 40-45 minutes.
- Genres that are considered masters of long-term retention, such as Card, Trivia, and Word games, have an average session length of around 10-12 minutes.
Retention Rate
Retention rate is a metric that shows how long players keep playing after the first install.
Retention rate directly affects your earnings, so keeping track of it is vital. It helps to understand what aspects of the game encourage players to keep playing.
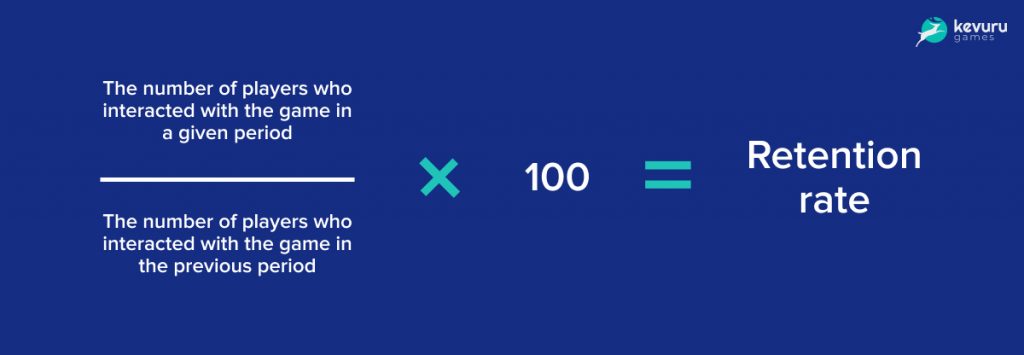
To calculate the retention rate, you need to divide the number of players who interacted with the game in a given period by the number of players who interacted with the game in the previous period, and multiply the resulting number by 100.
Basically, mobile game retention rates are tracked on Day 1, Day 7, and Day 30 to see if games are built to last. However, you can also measure retention at Day 60 and Day 90 to get even more insight into how many players stay engaged.
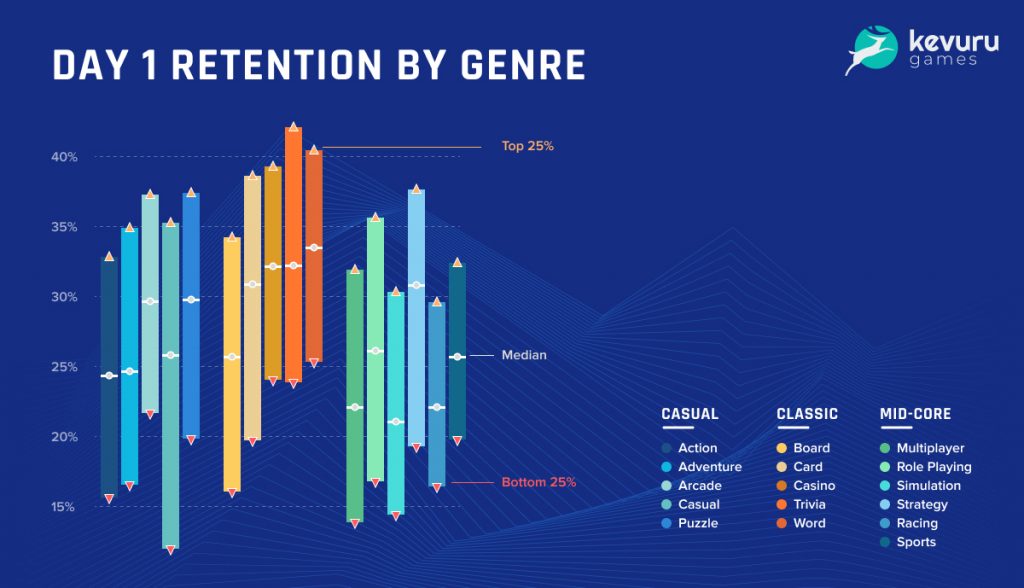
- Day 1 retention. These are first impressions. The user gets acquainted with the game and decides whether it is interesting and whether it is worth returning. 30% retention or more on the first day is considered a good result.
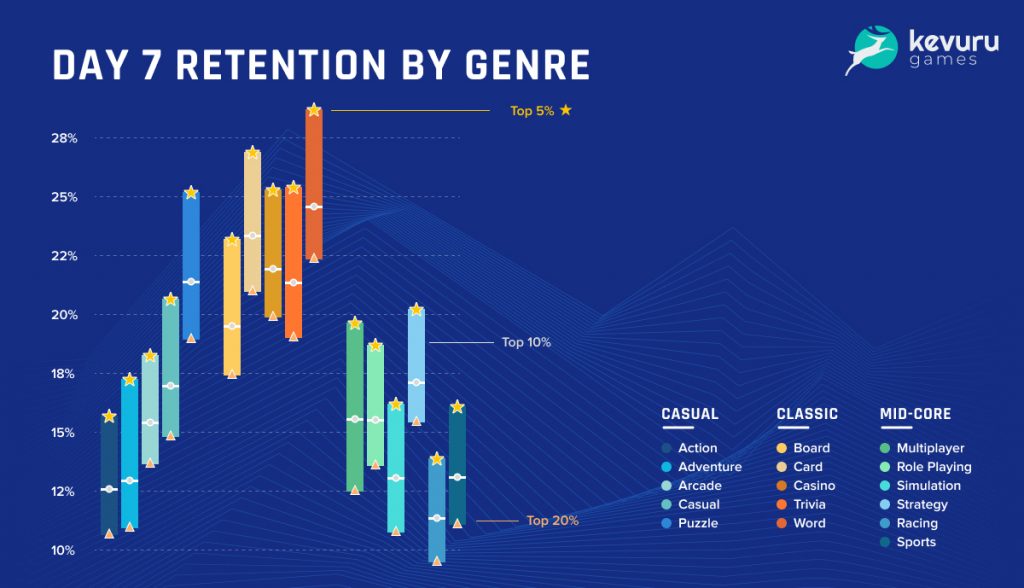
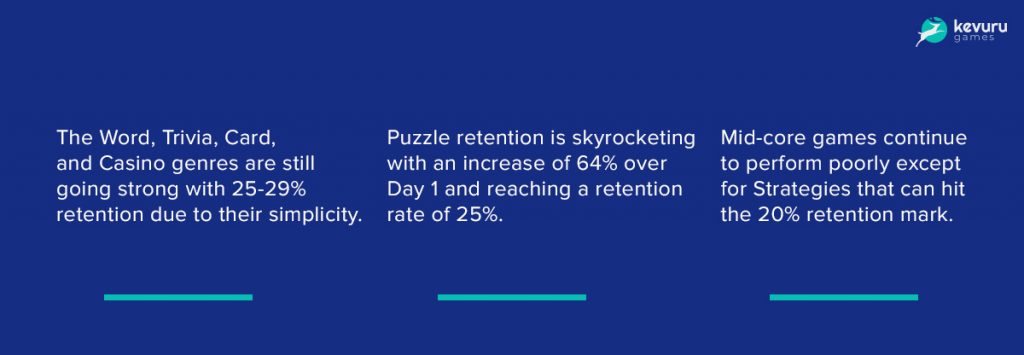
- Day 7 retention. At this stage, the player is already familiar enough with the game and can give a detailed explanation of its pros and cons, the convenience of the interface, and the overall experience. If all is well, the players continue to play.
- Day 28 retention. At this point, all dissatisfied or disinterested players are weeded out and what remains is your main base of loyal players who play the game weekly or daily. They are willing to make a purchase or watch ads to gain in-game benefits.
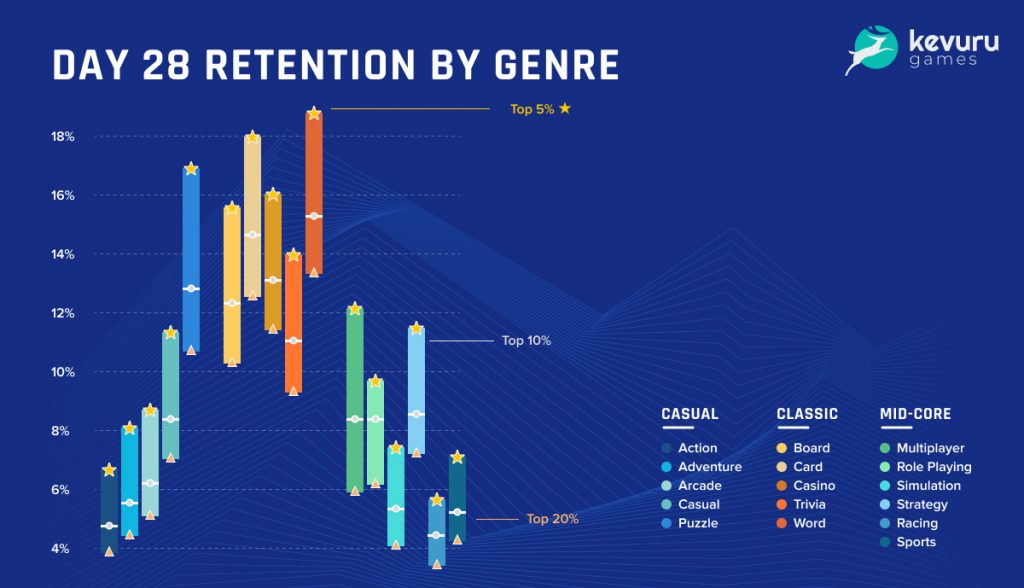

Did you know? The retention count starts on Day 0, not Day 1. Day 0 is the game download day, and Day 1 is the first retention test. This is often overlooked. If a player does not open the app on Day 1, then they are not retained.
Interesting facts about retention
- On average, a 40-20-10 profile is considered good retention ‒ 40% retention on Day 1, 20% retention on Day 7, and 10% retention on Day 30. But depending on the genre of the game, good retention rates may vary.
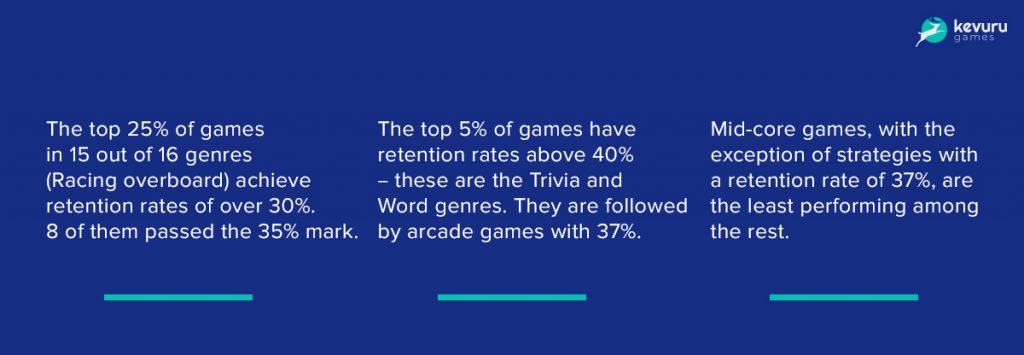
- According to Gameanalytics, the average Day 1 retention rate is 25%. The top 5% of games can boast 46% are Trivia and Word games. Arcade games follow with 35%. Midcore games have the lowest engagement rates.
- A curious observation is that people play a lot more during the Christmas and New Year celebrations, but when the holidays are over, they don’t necessarily go back to the games they played.
Churn Rate
The churn rate is a metric that shows how many players deleted the game after the first game session.
The exact opposite of retention rate, churn rate captures the number of people who installed a game, played it, and immediately uninstalled it. It includes the time that has elapsed from the moment the game was installed to the moment the game was uninstalled. If it’s a few hours, then the game may be having issues with onboarding and players need a clearer guide. If it’s a few weeks, then perhaps the content has become repetitive and the player has become bored.
To calculate the churn rate, subtract the retention rate from 100%.
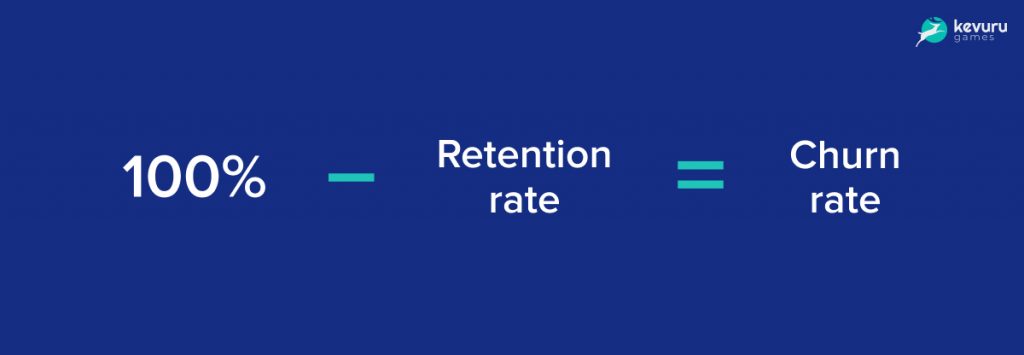
According to Clevertap, most games lose over 90% of new players in the first month after installation. The most common reasons for deleting games are crashes and errors, but gameplay problems can also occur:
- Too long onboarding.
- Confusing interface.
- Too bright visuals.
- Unintuitive gameplay.
- Too many ads.
- Aggressive monetization strategy.
Additional hint. If you still can’t figure out why people are deleting your game, look for valuable insights in the comments section of Google Play and App Store.
The Most Important Game Metric
All these metrics are very important. But there is one more that stands above them all ‒ Lifetime Value (LTV).
Lifetime value is a metric that shows the average income generated by the client during the entire period of interaction with the game.
With this game metric, you can determine how effective your game is over time and what is the total income that you received per user for the entire time they interacted with the game.
LTV affects the amount of revenue ‒ the more regular customers a company has, the higher the income. But the indicator needs to be compared with other metrics. If the LTV is high, but the company’s costs of producing a product, attracting and retaining a customer are higher, then the business is not making a profit and the overall strategy needs to be reconsidered.
To calculate LTV, you need to multiply the revenue per user (ARPU) by the so-called Lifetime ‒ the total duration of interaction with the user.

Is your project profitable? If LTV is less than User Acquisition Cost, then the answer is no.
Ways to Measure Game Metrics
There are two main ways to measure gaming metrics:
- Request feedback from players directly.
- Use individual data analysis systems.
The first option is easily implemented by researching game forums where players discuss the game, or by reading player comments directly on the game’s download page. Many game companies have a separate technical support service where players can write about questions or problems that arise. Direct feedback from players often provides high-quality data that cannot be obtained from raw data analysis.
The second option involves the use of internal quantitative data viewing systems. Each company has its own such systems and data warehouses. They categorize data into groups and calculate specific metrics for retention, engagement, spending, revenue, and more. In the case of larger multiplayer games, companies can use tools for more in-depth analytics of mobile game metrics, for example, assessment of interaction and conflicts between players, compliance with community rules, etc.
The Bottom Line
To paraphrase a famous quote, one does not simply ignore gaming metrics. High-quality analytics is your steering wheel to help you move in the right direction and achieve financial success. And success will be achievable only when you can give your users what they want.
Our game designers keep all the necessary metrics in mind while compiling a game design document and make game economy design. By describing its gameplay and technical characteristics, they not only shape its overall concept, but also suggest the best ways to promote it, depending on the specifics and genre. At each stage of work, game designers give recommendations in order to get a flawlessly optimized deeply engaging product as a result.
Trust our experience and we will make all video game engagement metrics work for your success.


