
The global video game industry is worth over $180 billion in 2026 and is projected to pass $210 billion by 2028. Mobile leads with roughly half of all revenue, followed by console and PC. Key growth drivers include free-to-play, cloud gaming, and AI.
If you were an alien who just came to Earth and decided to take a look at the statistics data of the gaming market in 2026, you could easily come to a conclusion that this industry is not doing great and probably isn’t worth investing in.
This could be rational from the point of view of the bare numbers, but it’s far from the truth. Why would an alien be wrong? Because they don’t know the context that every human on Earth knows: in 2020, the world market was shaken by the pandemics. Some industries suffered, while others flourished, and gaming was the lucky one, as you probably know. It had experienced unprecedented growth. However, that growth rate couldn’t have held for long.
Ok, let’s say we all know the context, why start with explaining that? This is important to remind all of us when reading the data from recent years: it’s not very straightforward, and needs more thorough analysis. And this is what we’ll try to do now.
Global Game Industry Market Size in 2026
If you look at the most recent estimates, the global games market in 2026 is expected to move slightly above $200 billion. Different reports place it higher – sometimes closer to $220–230B – but those differences usually come down to what’s included, like advertising revenue or smaller web-based segments.
The most consistent baseline still comes from Newzoo report, with $188.8 billion of revenue for 2025. The estimates are average based on several industry reports.
The way money comes in has shifted a bit. It’s less about bringing in new players and more about keeping the existing ones engaged for longer. Most of the revenue now builds up over time – through updates, recurring purchases, seasonal content. That’s why a smaller number of games end up generating a large share of the total market.
Live service games are a big part of that. Titles like Fortnite or Genshin Impact don’t peak once and fade – they run for years and monetize gradually through updates, events, and content drops (talking about content drops, check out the work we did for Fortnite).
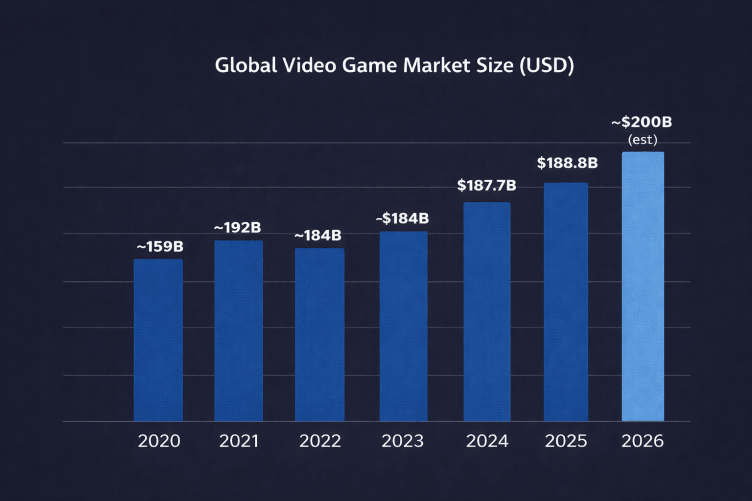
Global Market Size by Year
| Year | Revenue (USD) | Growth |
| 2020 | ~$159B | +9% |
| 2021 | ~$192B | +20% |
| 2022 | ~$184B | -4% |
| 2023 | ~$184B | ~0% |
| 2024 | $187.7B | +2% |
| 2025 | $188.8B | +0.6% |
| 2026 | ~$200B (est.) | +6% |
The pattern here is more important than the exact numbers. There was a sharp spike in 2020–2021, then a correction, and now things are growing again, but at a slower, more predictable pace. From a production point of view, that changes how studios operate. You can’t rely on market growth to carry a project anymore – it has to work on its own.
Revenue Breakdown by Platform
In its 2024 market estimate, Newzoo puts mobile at $92.6B, console at $56.1B, and PC at $39.5B. And each of these markets has its own rules.
Mobile is still the largest segment by a noticeable margin. But most of that revenue is concentrated in a relatively small number of titles, and scaling new games into that group has become much harder over time.
Console sits in second place, and it’s more dependent on big releases. A few major titles can shift the numbers for the whole segment in a given year, which makes it less stable than it looks from the outside.
PC is smaller in comparison, but it behaves differently. Revenue isn’t tied to a small set of top titles the way it often is on mobile or console. It’s distributed across a long list of games – from large releases to smaller indie projects that find their audience over time.
Because of that, sales don’t drop off as sharply after launch. A game can pick up traction months later – during a sale, after an update, or just from visibility on Steam. Over time, that adds up, which is why PC revenue tends to build gradually instead of peaking early.
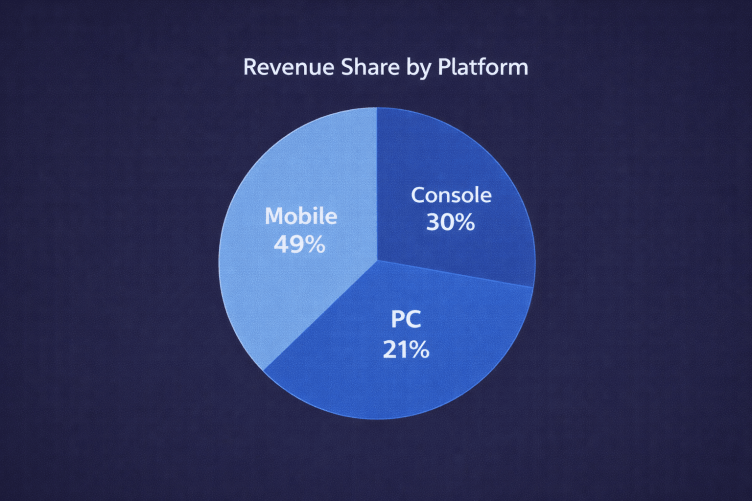
Revenue Share by Platform
| Platform | Revenue (USD) | Market Share |
| Mobile | $92.6B | 49% |
| Console | $56.1B | 30% |
| PC | $39.5B | 21% |
| Total | $187.7B | 100% |
The overall distribution between platforms has been the same for years. Mobile is still the largest segment, while PC and console keep a fairly stable share. What did change is the pace – mobile growth slowed down, PC picked up slightly, and console stayed tied to release cycles. So the balance is mostly the same, but the way each segment grows is now different. Mobile is scale-driven, PC is discovery-driven, and console is still largely hit-driven.
Regional Distribution of Game Revenue
If you break the market down by region, the structure hasn’t really changed. Asia-Pacific still takes the largest share, and it’s not even close. In Newzoo’s 2024 estimates, it accounts for roughly half of global revenue.
North America comes next, followed by Europe. Both are mature markets, so the audience size doesn’t change much year to year. To grow revenue, video games don’t look for new players, as there are already lots of them. The key is to engage existing fans in deeper spending habits.
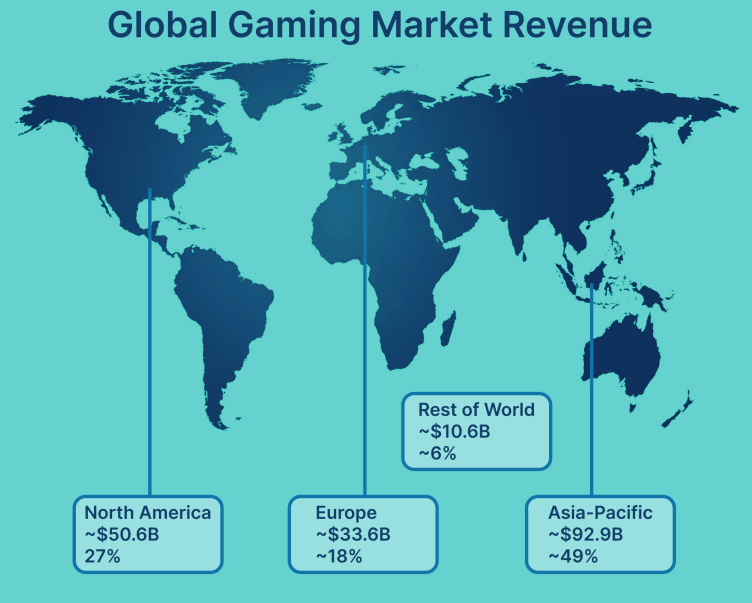
Revenue by Region
| Region | Revenue (USD) | Share |
| Asia-Pacific | ~$92.9B | ~49% |
| North America | ~$50.6B | ~27% |
| Europe | ~$33.6B | ~18% |
| Rest of World | ~$10.6B | ~6% |
What’s been changing is not the order, but how each region grows. Asia is still the largest by a wide margin, but the market there is not growing as fast as it used to in previous years. In North America and Europe, the growth is steadier.
Game Genres and Revenue
If you scroll through Steam long enough, the pattern becomes pretty obvious. A lot of games fall into the same few buckets. Data from SteamDB backs that up – Indie, Action, and Adventure show up more often than anything else in the catalog on Steam.
These are tag shares, not exclusive genres. One game can carry several tags, so the percentages overlap and won’t sum to 100%. It’s a good way to see how crowded certain categories are, not a strict split of the market.
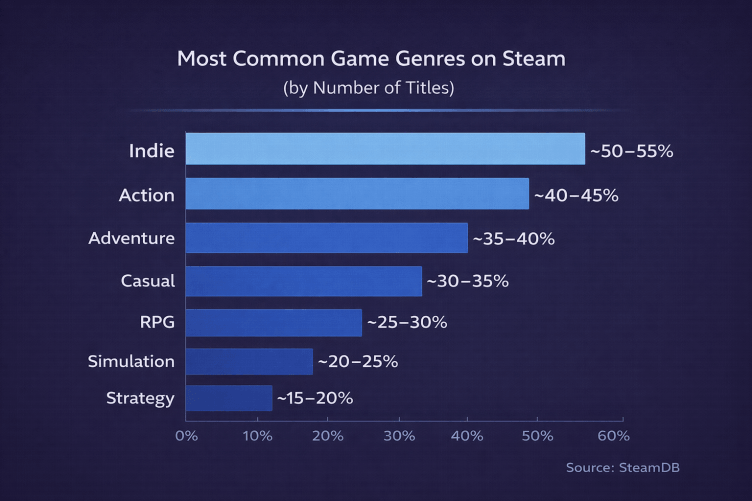
Most Common Game Genres on Steam (by number of titles)
| Genre / Tag | Share of Titles |
| Indie | ~50–55% |
| Action | ~40–45% |
| Adventure | ~35–40% |
| Casual | ~30–35% |
| RPG | ~25–30% |
| Simulation | ~20–25% |
| Strategy | ~15–20% |
On the revenue side, the picture looks different. According to Sensor Tower, Puzzle and Casino games consistently sit among the top-grossing genres, with Puzzle alone bringing in billions each year globally.
A big part of that comes down to how these games are structured. Titles like Candy Crush Saga don’t rely on a single purchase. Revenue builds over time through small, repeated transactions and long-term player retention, which is why they show up at the top so consistently.
Here is comparison of highest revenue genres in PC/console and mobile markets (based on data from Newzoo, Sensor Tower, and Circana).
| Rank | PC / Console (Top Genres) | Mobile (Top Genres) |
| 1 | Shooter | Puzzle |
| 2 | RPG | Strategy |
| 3 | Sports | RPG |
| 4 | Action / Adventure | Casino |
| 5 | Open-world / Sandbox | Shooter |
This split highlights an important difference.
– PC platforms are volume-driven (many games in a few genres)
– Mobile is more revenue-concentrated (fewer genres dominate spending)
Another useful stat comes from Newzoo: genres tied to long-term engagement – like RPGs and shooters – tend to generate higher lifetime value per player, which is why they appear more often among top-grossing titles.
Number of Gamers Worldwide
The total number of players is still increasing. Newzoo Global Games Market Report estimates around 3.6 billion gamers worldwide in 2025.
That growth doesn’t come evenly from everywhere. Most of the increase is coming from markets where access improved – mainly through mobile. In regions like India or Southeast Asia, getting into games doesn’t require much beyond a phone, so the audience keeps expanding there while more mature markets stay relatively flat.
In more mature markets, it looks different. The audience is already there, so you don’t see big jumps in player numbers. Instead, the same users spend more time in games and move between titles or platforms.
Another thing to keep in mind is how broad that number really is. It counts everyone – from people who open a mobile game once in a while to those who spend hours every day in games like Fortnite or League of Legends.
So the total looks impressive, but it mixes very different types of players. Someone who plays occasionally and someone deeply engaged with a live service game are both included, even though their behavior – and value – is completely different.
Top-Grossing Games and Franchises
If you look at where the money actually goes, it’s pretty concentrated. A small group of games takes a large share, and everything else operates on a much smaller scale.
That’s not new, but the difference now is how stable that top group is. The same titles keep holding their positions year after year, so the gap isn’t just there – it keeps reinforcing itself.
Top Games by Annual Revenue (Newzoo)
| Game | Publisher | Release Year | Model |
| Fortnite | Epic Games | 2017 | Free-to-play |
| Call of Duty: Modern Warfare II / Warzone | Activision Blizzard | 2022 / 2020 | Premium + F2P |
| Grand Theft Auto V | Take-Two Interactive | 2013 | Premium + Online |
| Roblox | Roblox Corporation | 2006 | Platform / F2P |
| Genshin Impact | miHoYo | 2020 | Free-to-play |
What changed is how long these games hold their position. It’s not just a launch spike followed by a drop. Some games don’t rotate out of the top tier anymore – they lock into it and stay there.
Titles like Fortnite or Grand Theft Auto V have been generating revenue for many years and counting. Not because of a one-time launch push, but because they keep developing the game and pulling players back in (not just because they “got lucky” to become a cult game).
This changes how new projects compete. You’re not just launching against other new games – you’re entering a space where a few established titles already hold a large part of player attention.
Mobile Game Market Trends
At scale, mobile market is huge. According to Newzoo, mobile alone generated $92.6 billion in 2024, about half of the entire games market. That size attracts more studios, which only adds to the competition.
What’s changing in mobile games market in 2026 is the way that revenue is generated has shifted over the last few years. It’s no longer about pushing out large volumes of simple games and scaling them quickly.
One noticeable shift is what happened to classic hyper-casual. The model depended on very cheap user acquisition and fast ad monetization, and both became less reliable. Traffic got more expensive, and hitting the scale needed to stay profitable became harder.
In response, many studios moved toward hybrid-casual. The core gameplay is still simple, but there’s more structure around it – progression, upgrades, some form of meta. Instead of short sessions and quick churn, the focus is on keeping players around longer and monetizing beyond ads.
At the same time, competition didn’t ease up. There are more games coming out, but getting noticed became harder. Distribution is open, but attention is limited, so even small mistakes in retention or monetization can kill a project early. The number of releases is high, and visibility is limited. Even if the entry barrier is low from a production standpoint, getting a game to scale requires significantly more investment than it did a few years ago.
PC and Steam Market Growth
PC hasn’t changed dramatically in size, but it became more active. A big part of that comes from how distribution works now. Releasing a game is no longer the hard part – platforms like Steam made that relatively straightforward.
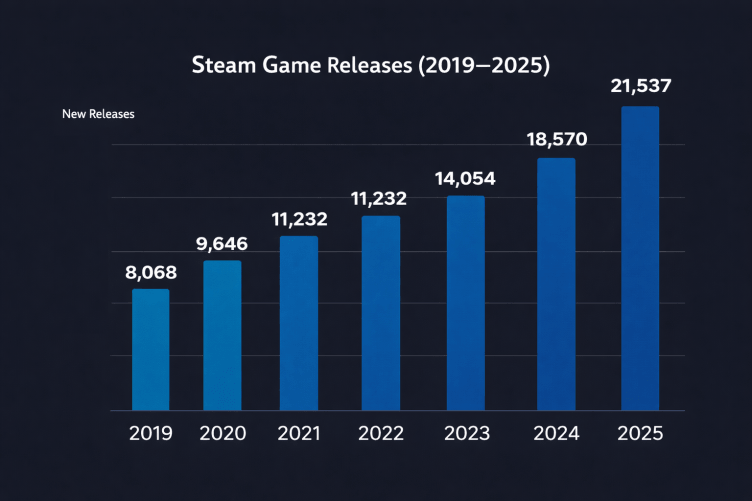
What changed is volume. According to SteamDB, over 14,000 games were released on Steam in 2023, compared to around 8,000 in 2018. That growth didn’t come from big studios – most of it comes from smaller teams and independent developers.
This creates a different kind of market. There’s a constant inflow of new titles, but visibility becomes the main constraint. Getting a game onto the platform is easy, getting players to notice it is not.
At the same time, PC has a stronger “long tail” than other platforms. Games don’t just disappear after launch. Through sales, updates, and recommendations, they can keep generating revenue long after release – sometimes years later.
Console Market and AAA Production Costs
Console is still driven by big releases. A relatively small number of titles generate most of the revenue each year, and the gap between them and the rest is significant.
What changed is how expensive those titles became. The prices for development of top titles go about $100-200 and higher. Studios don’t like to give exact numbers, but a couple of years ago Sony leaked some internal info in court-disclosed documents that put The Last of Us Part II at about $220 million and Horizon Forbidden West at about $212 million.
Development timelines also stretched. It’s not unusual for a AAA project to take 4–6 years from concept to release. That creates pressure on studios, because fewer games can be produced, but each one carries more risk.
You can see this in how releases are spaced out. Console platforms rely on a smaller number of flagship titles to drive engagement and hardware sales. When those titles land successfully, they can define the year. When they don’t, the impact is noticeable across the whole segment.
Investment, M&A, and Market Consolidation
The biggest wave of acquisitions is behind, but deals are still happening – just in a different form. Instead of large consolidation moves, recent years lean more toward focused bets.
A good way to see the shift is by looking at what kind of deals are happening now. Savvy Games Group buying Scopely for $4.9 billion is a clear bet on mobile and live service rather than broad consolidation. The Take-Two Interactive deal for Gearbox Entertainment is smaller ($460 million) and more targeted – more about specific IP than scale.
At the same time, some companies are going the other way. Embracer Group spent a few years buying studios and then had to reverse course – selling assets, shutting projects down, and restructuring. That kind of correction didn’t happen as often before.
The overall activity level also changed. According to Drake Star Partners report, total gaming M&A and financing value reached about $27.3 billion in 2024. Deal activity in 2025 continued, but without large spikes.
Most of the movement comes from mid-size transactions and strategic investments rather than large-scale acquisitions. That’s a recovery from the slowdown, but still far from the peak levels seen a few years earlier (around $127 billion in 2021).
Compared to a few years ago, the logic is simpler. Fewer big swings, more careful positioning. Companies still invest, but they tend to know exactly why they’re doing it.
Conclusion
The market is still growing, but it’s not expanding in a way that makes things easier. Most of the structure is already in place – same platforms, same regions, same top-performing games holding their positions. What changed is how competitive everything became around that structure.
Growth is still there, but it builds up differently now. Instead of new audiences driving the numbers, it’s the same old players spending more and staying longer in the same ecosystems. Of course, there are always new users, but they don’t change the picture the way they used to. The base is already there. What changed more noticeably is on the production side – games take longer, cost more, and each release carries more weight, so there’s less room for things to go wrong.
What really stands out is how stable the top layer is. The same games and ecosystems keep holding their ground, and they don’t rotate out as quickly. For new projects, that changes the goal. It’s not just about launching successfully – it’s about staying visible and relevant long enough to compete.


